Dashboard cards
Spot Forecast ships no Lovelace card of its own. It ships two dashboards for
the Plotly Graph Card
(custom:plotly-graph), written for and tested on v4.0.2.
- Install Plotly Graph Card from HACS (category Dashboard) and reload the browser.
- On a dashboard: Add card → Manual, and paste one of the YAML files.
Both cards read only the integration's fixed entity ids, so they work
unchanged on any instance language. Their labels, numbers and dates follow the
Home Assistant language: German when it starts with de, English otherwise.
Every label sits in the table T at the top of each card's first filter.
Below, labels are given in English with the German one in parentheses.
The cards are written for the zone DE-LU. For another zone, replace every
de_lu in the YAML with the zone's id: nl, dk1, dk2 or no2 (as in
sensor.spot_forecast_nl_price and spot_forecast:nl_price). Prices stay in
EUR, as the integration reports them for every zone.
Forecast card
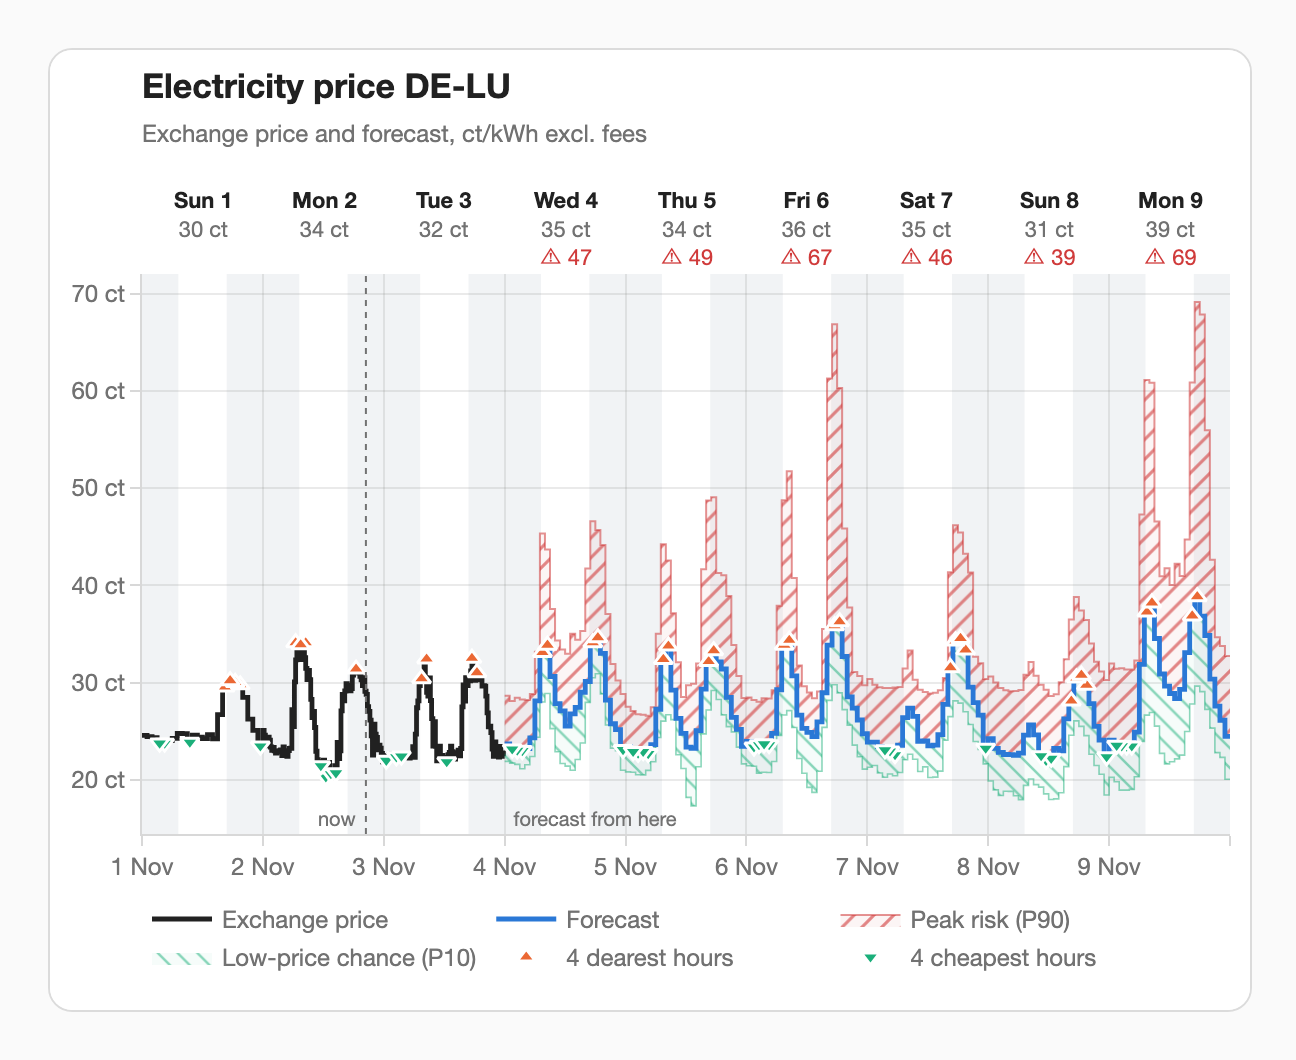
One time axis from yesterday to the end of the forecast:
- known prices (yesterday from the statistics, today and tomorrow from
prices) as a solid step line in the theme's text colour; - the forecast (expected price) as a blue step line;
- the peak risk hatched red from the expected price up to P90;
- the low-price chance hatched green from P10 up to the expected price, so likely negative hours reach below the zero line;
- per day the 4 dearest (▲) and 4 cheapest (▼) hours;
- above each day its weekday, date and maximum, and "⚠ up to NN" ("⚠ bis NN") in red when the peak risk crosses the threshold of the peak-risk sensor; on a narrow card the header shortens step by step to "Mon 26" / "27 ct" / "⚠ 25" ("Mo 26." / …) and then to the weekday alone;
- nights shaded from
sun.sun, and a dotted "now" ("jetzt") line where the forecast begins; - with the option grid fees and taxes set, two buttons top right: "Exchange" ("Börse", the default) and "incl. fees" ("mit Abgaben"), which shows every price, band and day maximum as the total price: VAT on the exchange price plus the surcharge. The "⚠" warning still compares the exchange price with the threshold. The choice holds until the page is reloaded.
Prices are shown in ct/kWh (EUR/kWh × 100), with English or German number formatting ("3.2 ct" / "3,2 ct").
Look-back card
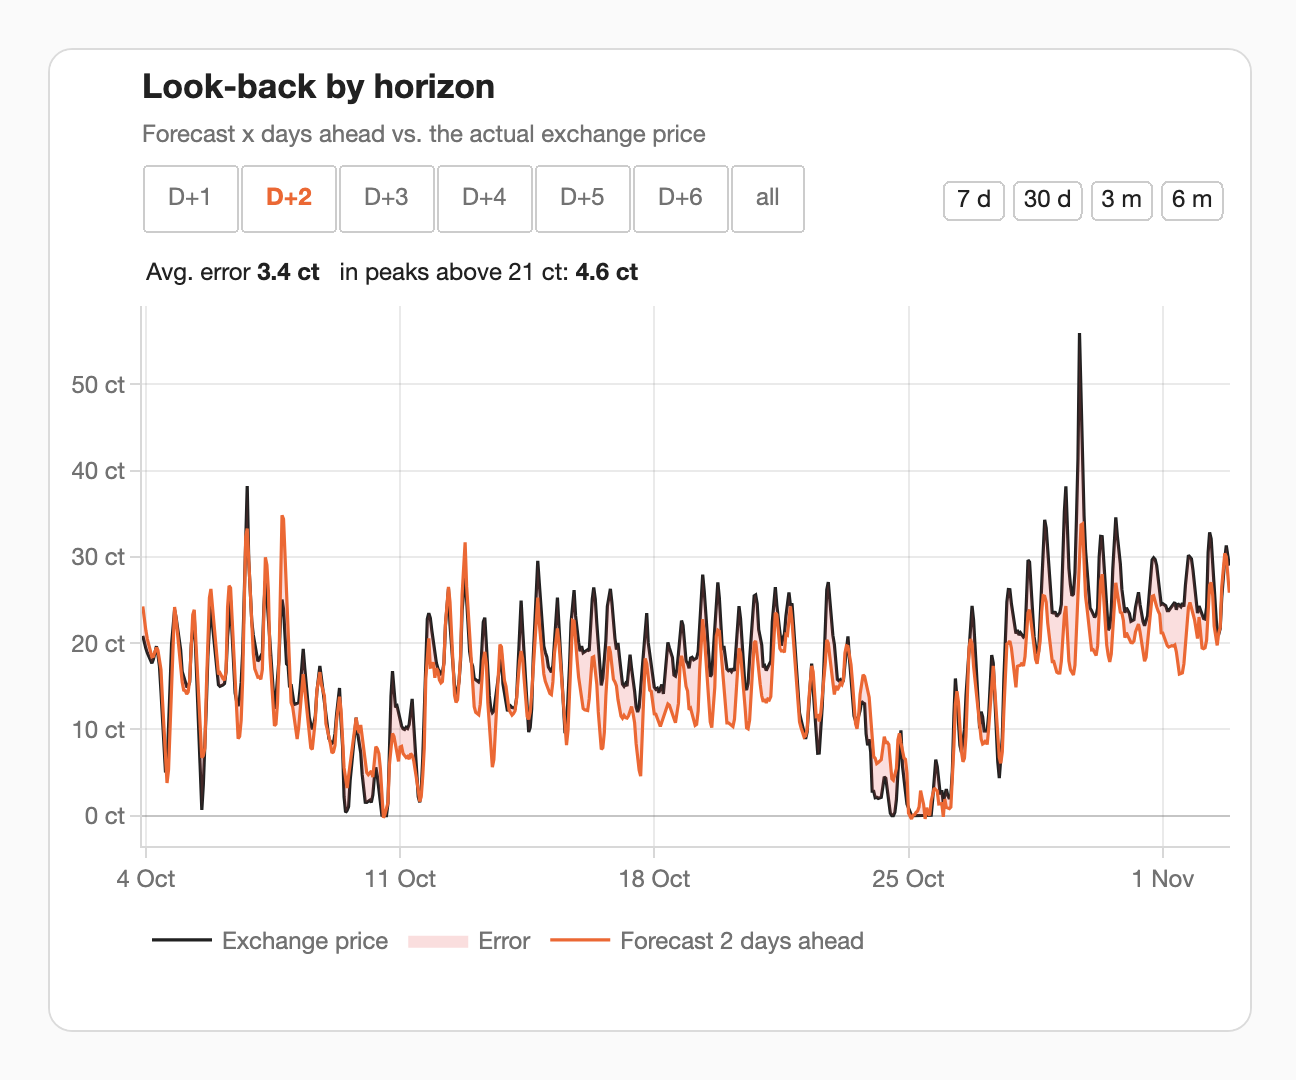
How good were past forecasts on your install? The card draws the actual price against the forecast made h days before, from the long-term statistics:
- the buttons on the left choose the horizon, D+1 … D+6, or all (alle: all six lines, no fill); with one horizon, the gap to the actual price is filled red;
- the buttons on the right choose the range: 7 d, 30 d, 3 m, 6 m (7 T, 30 T, 3 M, 6 M);
- above the plot: the mean absolute error of the shown horizon over the shown range, and the error in the hours above the peak threshold.
It has content from the first day, thanks to the backfill. The horizon choice holds until the page is reloaded and is shared by all look-back cards on the page.
How the screenshots are made
The images in the README, on the website and on this page are rendered by
tools/gen_card_screenshots.py:
it mounts the shipped YAML in the released Plotly Graph Card bundle, in English
and in German, against the states and long-term statistics of a real
installation: a snapshot taken on 2 November 2026 with
tools/snapshot_live.py.
That moment lies a month after the model's training cutoff, so the forecast in it
is out of sample. Before publishing, the snapshot drops personal values: the
surcharge is set to 0 and the sun times are those of the middle of Germany.
The edge cases (clock changes, a stale forecast, a fresh install, the fees view)
are rendered from scenarios that the integration's own code computes from the
bundled model and research data
(tools/card_scenarios.py).