 wetterrekord
🔥
Heat
Today’s maximum temperature against the station’s Tmax records.
wetterrekord.de is a live map of weather records in Germany. For more than 330 weather stations it compares today’s values with each station’s own history — some series reach back to 1781.
Every station is checked against its record for the same calendar day, the half-month, the month — and all time. The colour shows how far today goes.
Only stations with at least 30 years of history for a parameter take part — about half of the series start before 1950.
Today’s maximum temperature against the station’s Tmax records.
Today’s minimum temperature against the station’s Tmin records.
The strongest gust of the day — storm records per station.
The daily total, accumulating through the day.
Daily mean at sea level — highs and lows, meaningful towards evening.
A “Now” view with the latest 10-minute values, a sortable table, filters and a timeline to look back up to 96 hours.
Built entirely on the Climate Data Center of Deutscher Wetterdienst. Inspired by recordpy.fr.
On first start, ~340 station archives of daily climate data are downloaded and every record is computed into SQLite. Recomputed daily at 04:30.
Every 15 minutes the DWD 10-minute observations give today’s max and min so far — published with about 30 minutes of latency.
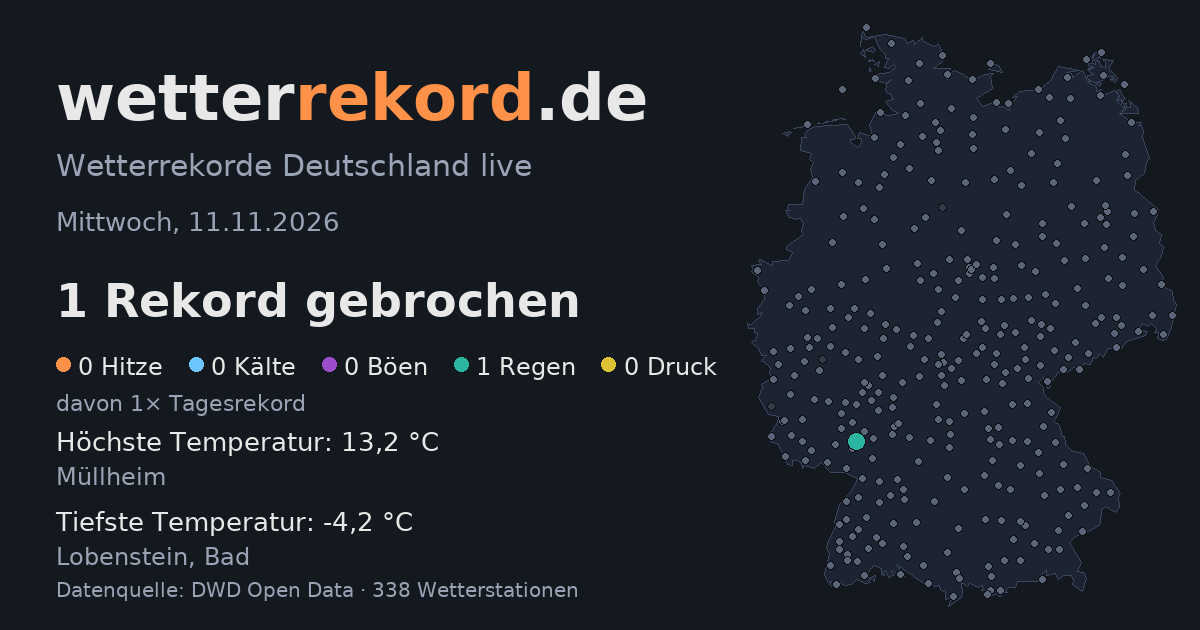
FastAPI serves the comparison to a Leaflet map; a share image of the day is rendered on the server for every link preview.
One container, one volume. The map fills up once the first import is done.
git clone https://github.com/cygnusb/wetterrekord
cd wetterrekord
docker compose up -d
Then open http://localhost:8000. Images:
ghcr.io/cygnusb/wetterrekord and cygnusbn/wetterrekord.
WETTERREKORD_BASE_URL | public URL for canonical links, sitemap and share images |
WETTERREKORD_LIVE_POLL_MINUTES | live poll interval (15) |
WETTERREKORD_INGEST_HOUR | hour of the daily recomputation (4) |
WETTERREKORD_IMPRINT_HTML | operator’s legal notice, enables /impressum |
The map updates every 15 minutes — on hot and cold days it is worth a look.